Most of the examples in AmbiqSuite use SWO interface to print the debug message. Generally, one can use the J-Link SWO Viewer that came along with the Segger softpack, however, the tool sometimes has access conflict to the J-Link debugger while launching IDE debug at the same time. It is also very convenient to see the SWO log inside an IDE, this article introduces how to do that in IAR.
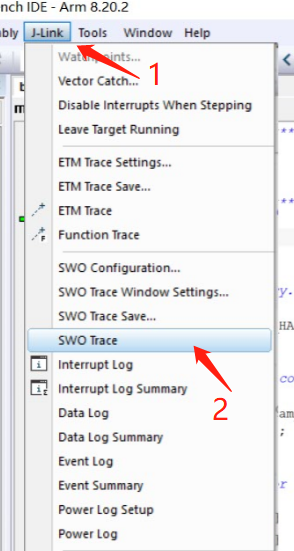
- Open an IAR example project in the SDK, and compile, connect the evb to computer, enter the debug mode, it will pause at the main entry. Click on the menu J-Link -> SWO Trace to open the SWO Trace window.
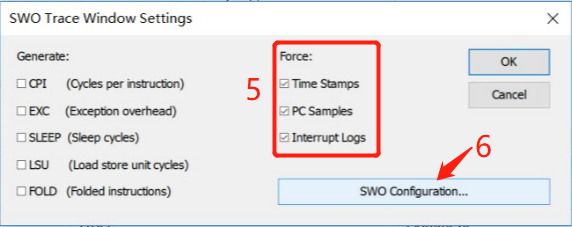
- Click on the power button, and then option setting button, enable the three Force options, and then click on the SWO Configuration button.

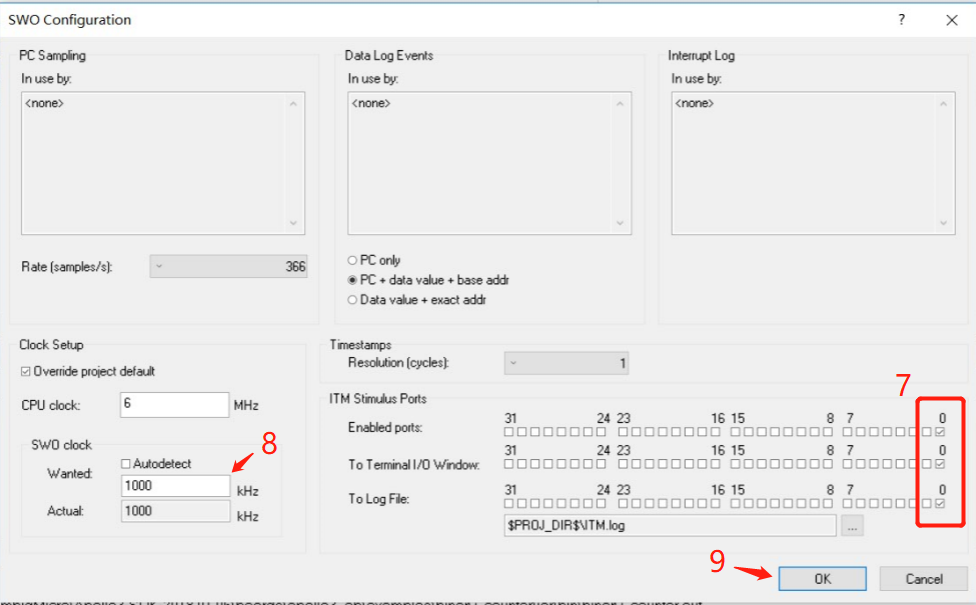
- Enable the port 0 for To Terminal I/O Window, leave the SWO clock 1000kHz as default, then click OK button. You may need to check step 7 every time you launch the debug mode.
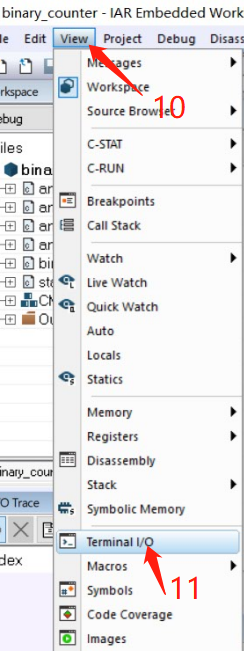
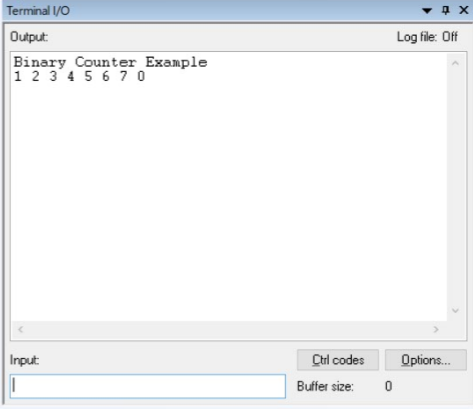
- Click on the menu View -> Terminal I/O to open the Terminal I/O window, then press F5 to run the example.
- Now, you can see the output message in it.
Happy coding.
Comments
0 comments
Article is closed for comments.